
Home > Wednesday Wisdoms: Newsletter > Get Comfortable with Being Uncomfortable
Jump to Section:
Get Comfortable with Being Uncomfortable for A-Level Economics Mastery
Here are 3 reasons why you might be struggling to get top grades in Economics:
Here's how you can overcome these challenges:
'The everything app': Why Elon Musk wants X to be a Wechat for the west
Summary:
A Level Economics Questions:
Possible A Level Economics 25 Marker Question
Infographic of the Week
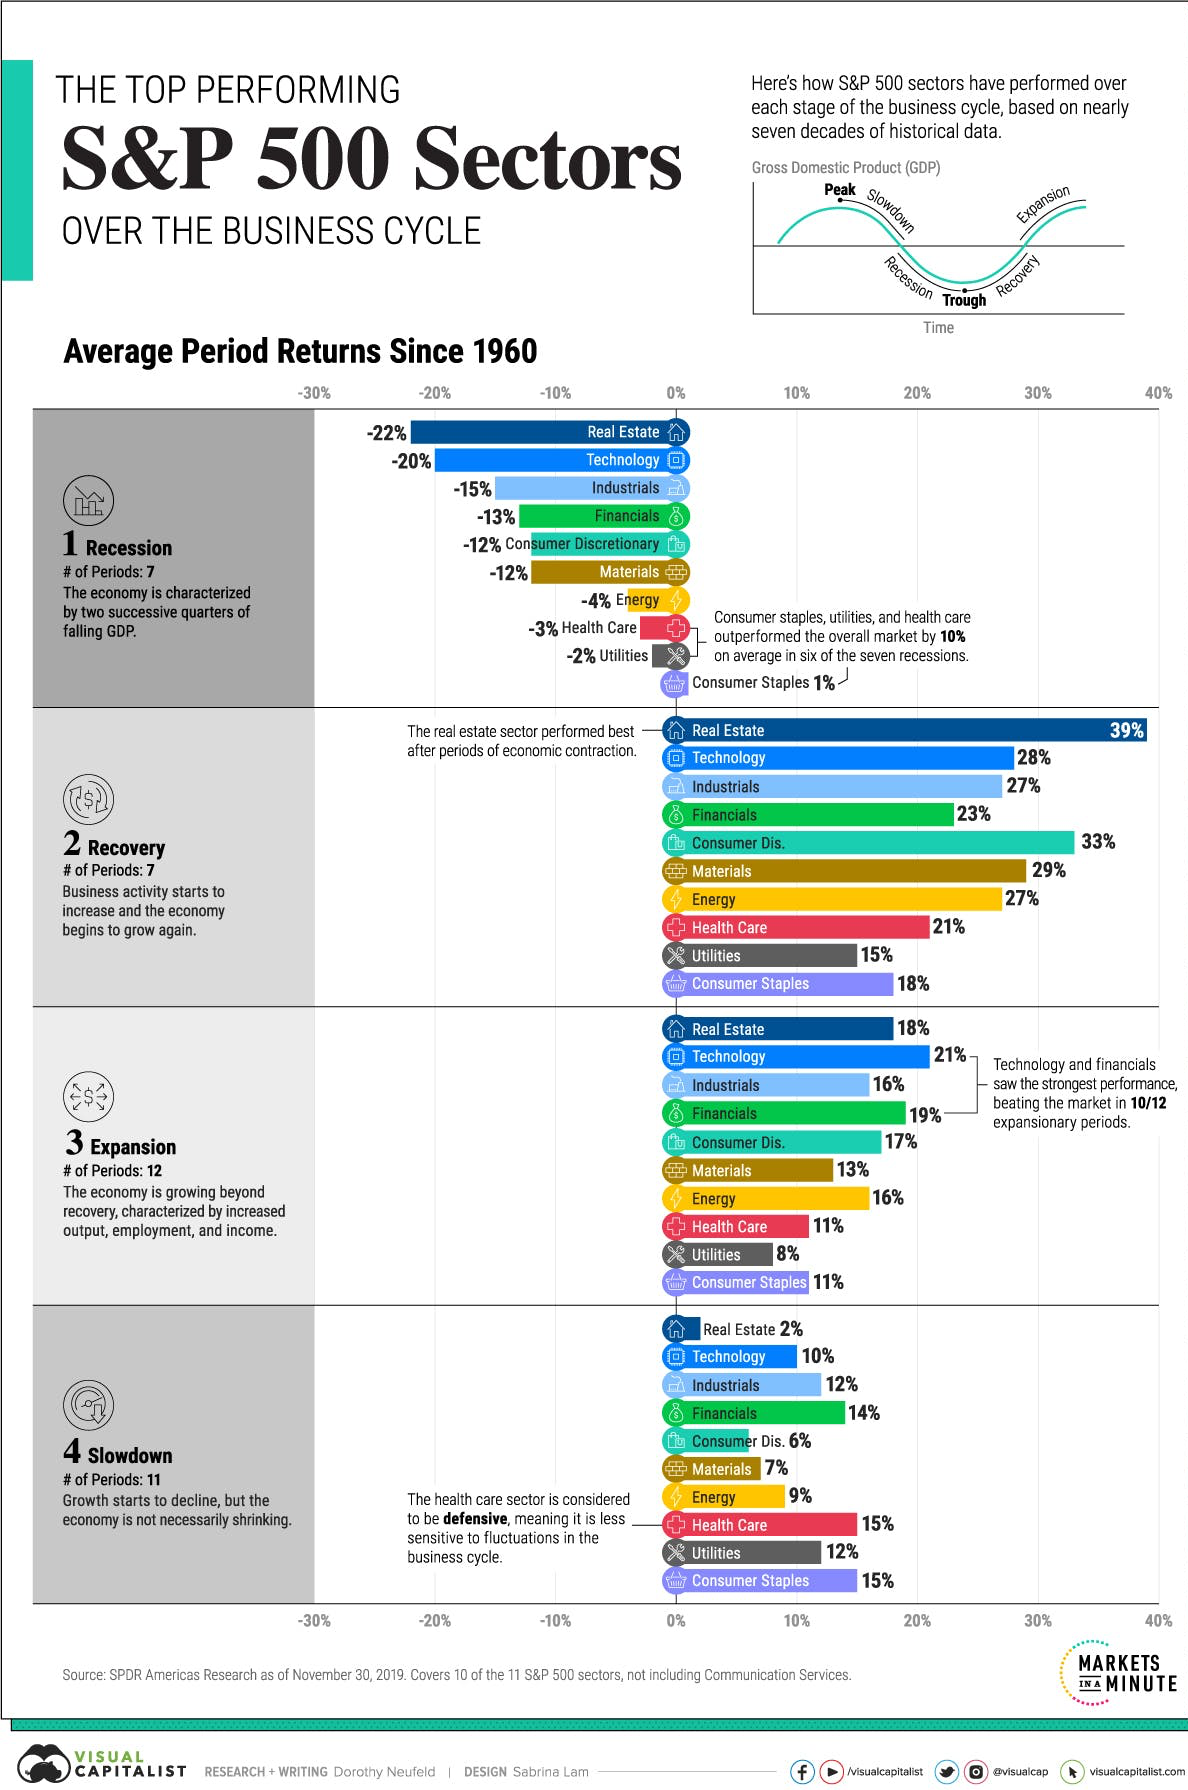
The Top Performing S&P 500 Sectors Over the Business Cycle
The business cycle fluctuates over time, from the highs of an expansion to the lows of a recession, and each phase impacts the performance of S&P 500 sectors differently.
And though affected sectors have different levels of average performance, any given period may see the outperformance of certain sectors due to external factors, such as technological advancements or high-impact global events (i.e. global pandemics, international conflicts, etc.)
Chart of the Week
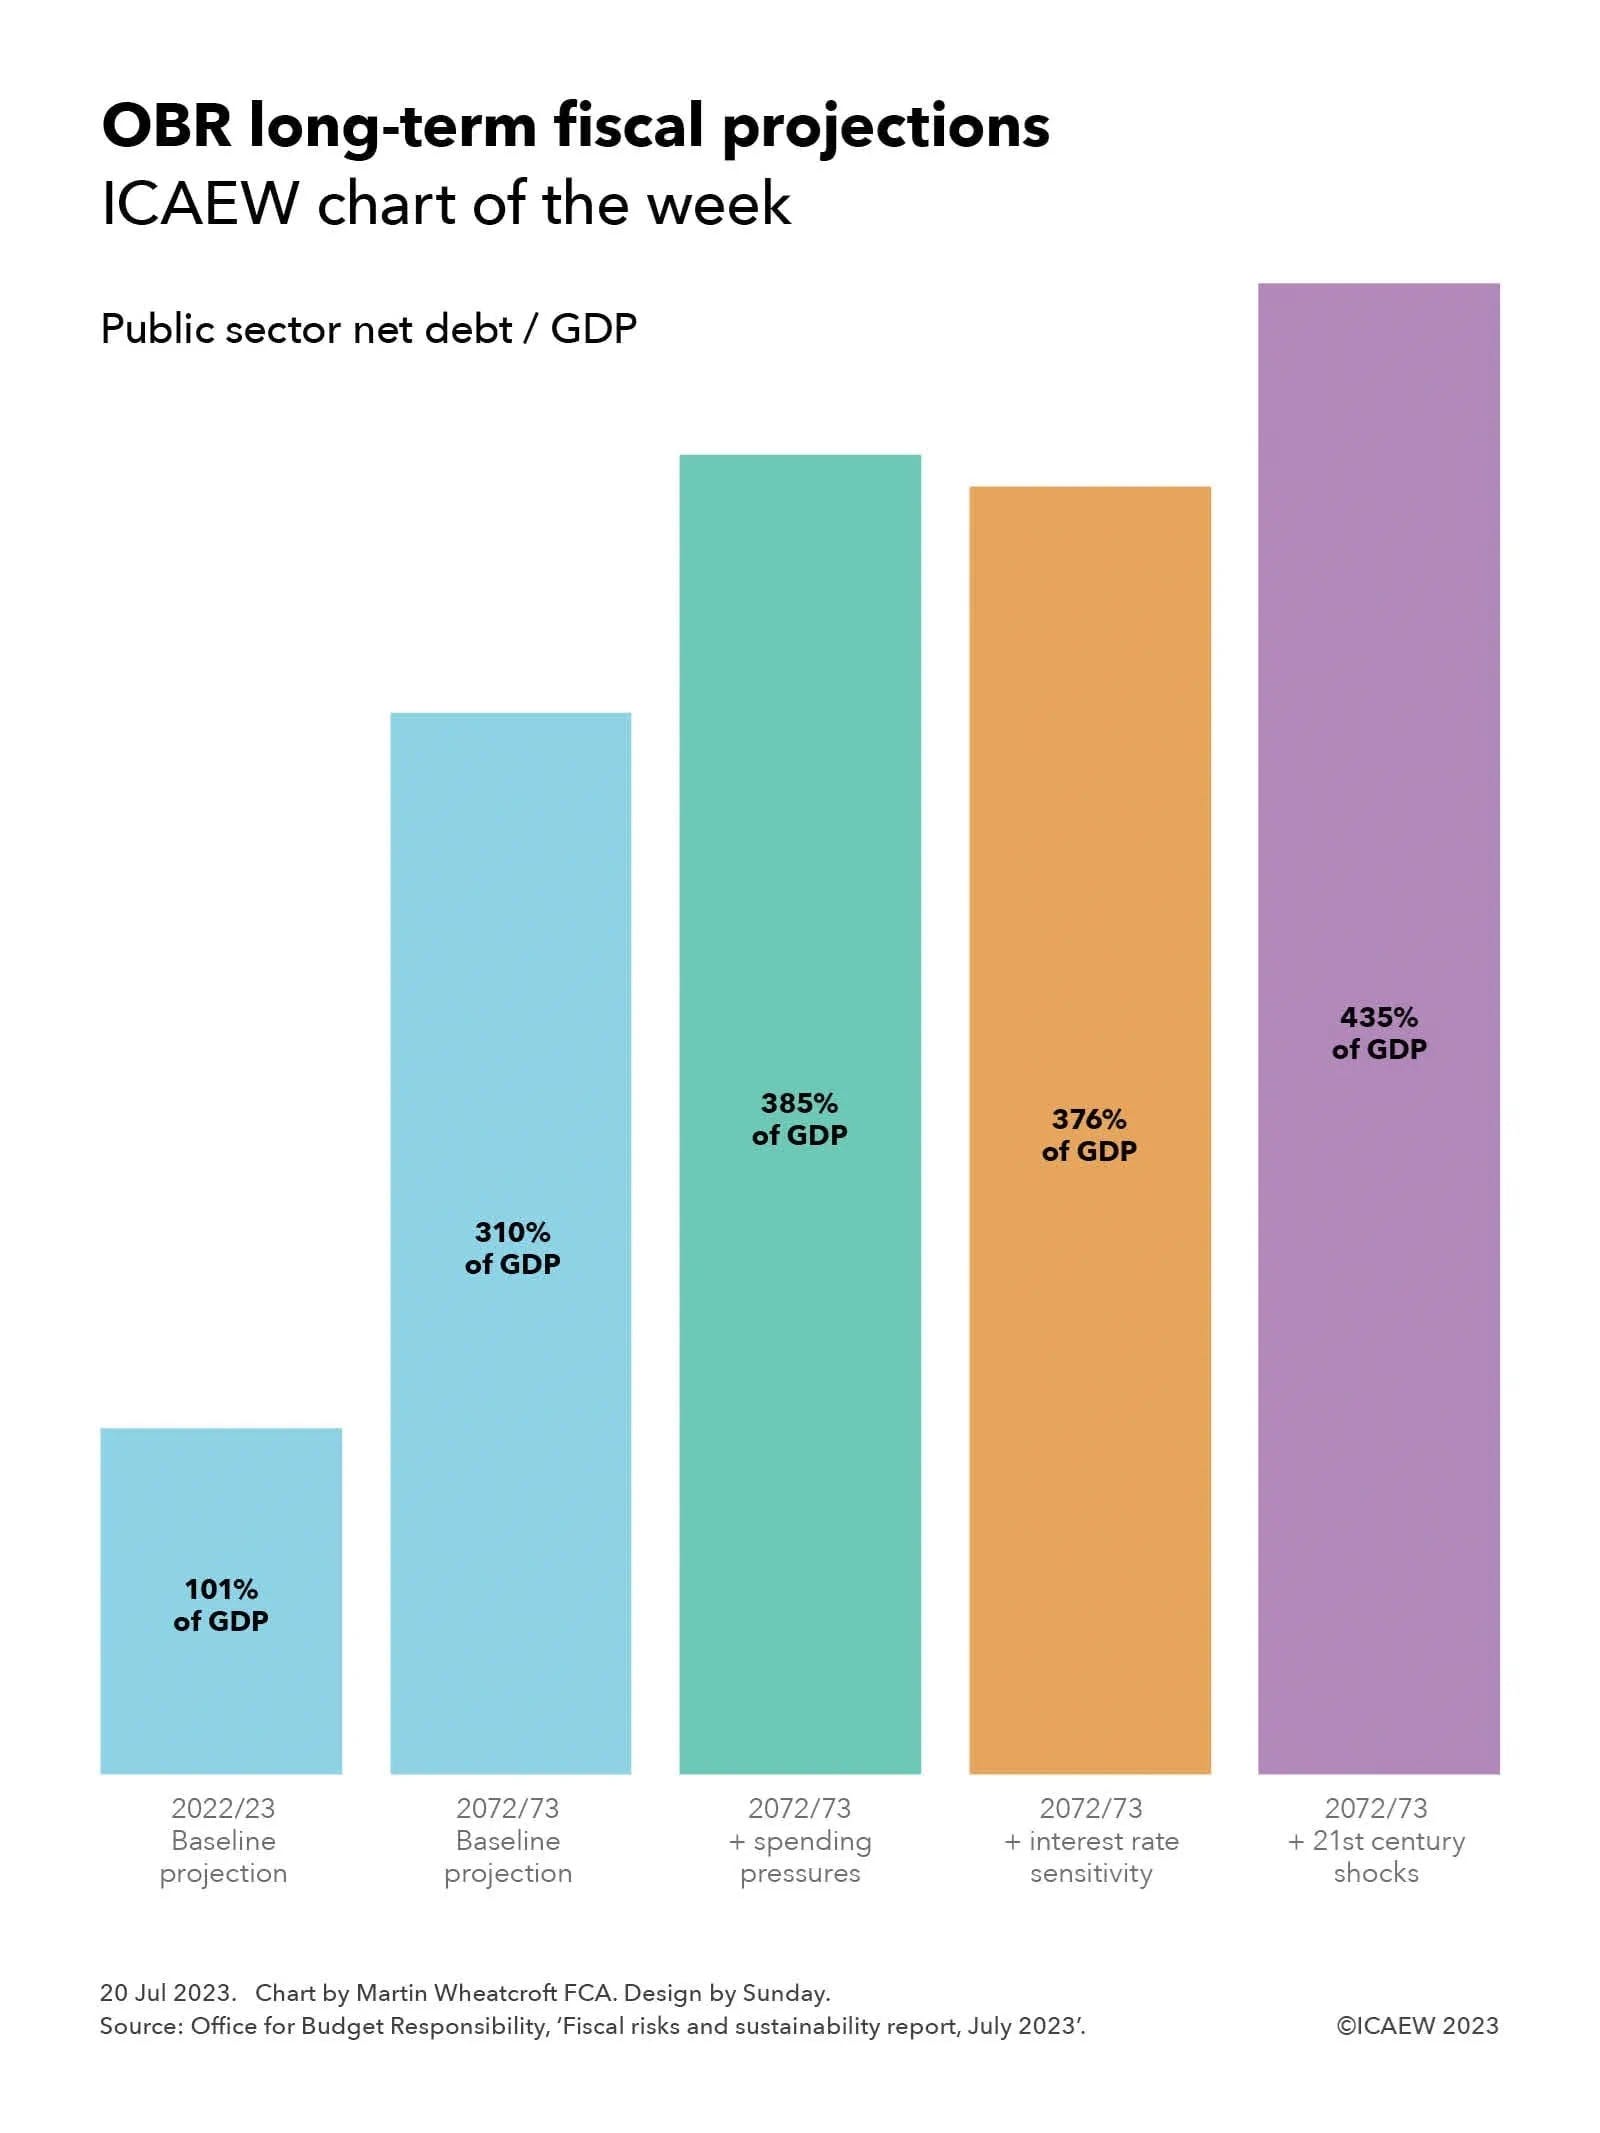
This week's chart of the week highlights The Office for Budget Responsibility (OBR) publishing its analysis of the key risks confronting the UK public finances and long-term fiscal projections for the next 50 years.
As illustrated by this week’s chart, the OBR’s baseline projection suggests that the ratio of public sector net debt to GDP could rise from 101% of GDP in 2022/23 to 310% of GDP in 2072/73. The OBR also presented three alternate scenarios: the first is based on higher levels of spending, which could result in the ratio reaching 385% of GDP; one involves higher interest rates, where the ratio might reach 376% of GDP; and a further scenario assuming additional economic shocks, where the ratio might hit 435% of GDP.
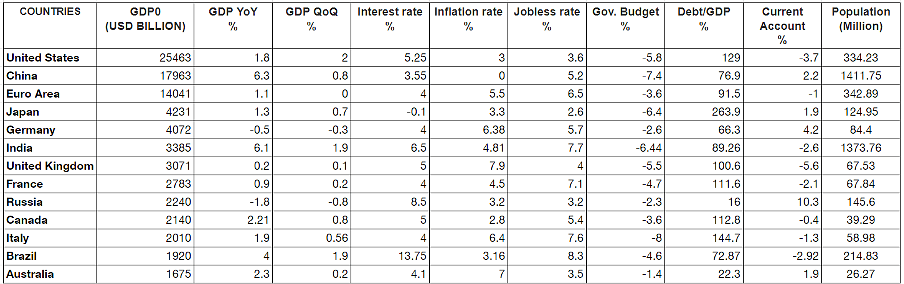
Macroeconomic Data
Whenever you're ready there is one way I can help you.
Emre Aksahin
Chief Learning Officer at Edgenie

Copyright © 2025
