Home > Edgenie Sunday Schroll: Newsletter > First 2 months of Year 13 are the most important ⚠️
Jump to Section:
Avoid the Biggest Mistake: Waiting Until Mocks to Get Serious!
Sterling rises after UK business activity grows more than expected
Summary
A Level Economics Questions:
Possible A Level Economics 25 Marker Question
Infographic of the Week

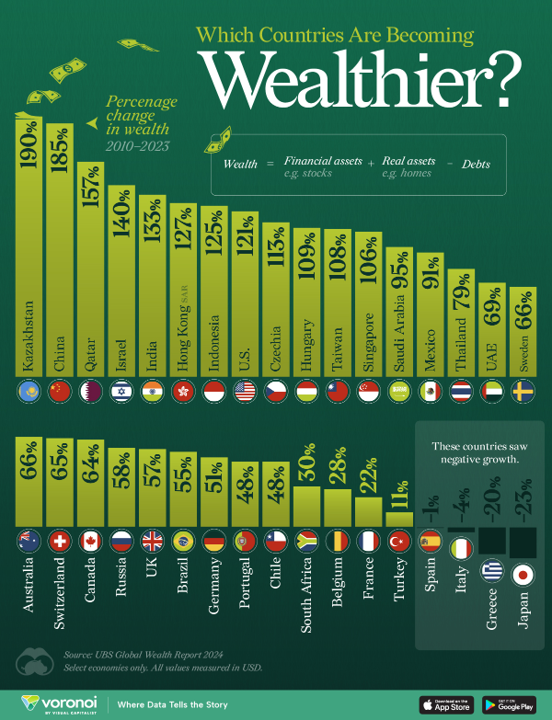
Global Wealth Growth from 2010 to 2023: Kazakhstan Leads, While Europe and Japan Lag
From 2010 to 2023, Kazakhstan experienced the highest percentage increase in wealth among 34 nations, with a 190% rise, driven by its rich natural resources. China followed closely with a 185% increase, supported by urbanisation, real estate growth, and improved financial access. Meanwhile, several European countries, including Spain, Italy, and Greece, along with Japan, saw negative wealth growth, largely due to the Eurozone debt crisis and Japan's prolonged economic stagnation.
Chart of the Week

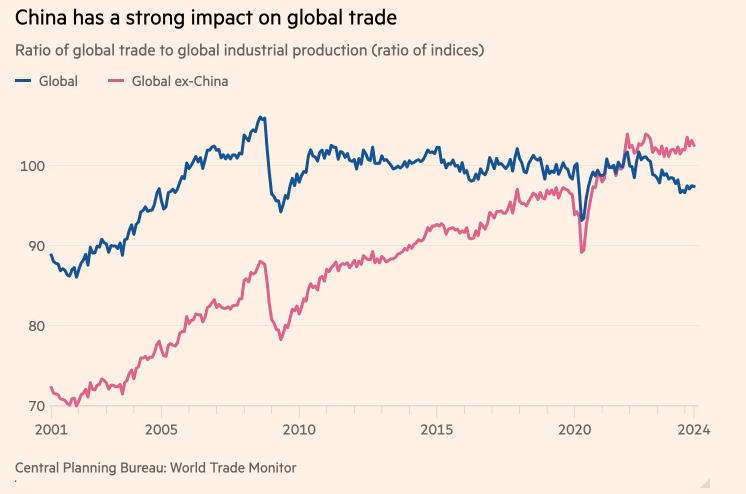
China's Significant Influence on Global Trade Dynamics
The graph illustrates the ratio of global trade to global industrial production from 2001 to 2024, highlighting the strong impact of China on global trade. The blue line represents global trade, which includes China, while the pink line shows global trade excluding China. The data reveal that China's influence has grown significantly over the years, with the global trade ratio consistently higher when China is included. Notably, the gap between the two lines widened around the mid-2000s, indicating China's rising role in global trade, which became especially pronounced during and after the 2008 financial crisis.
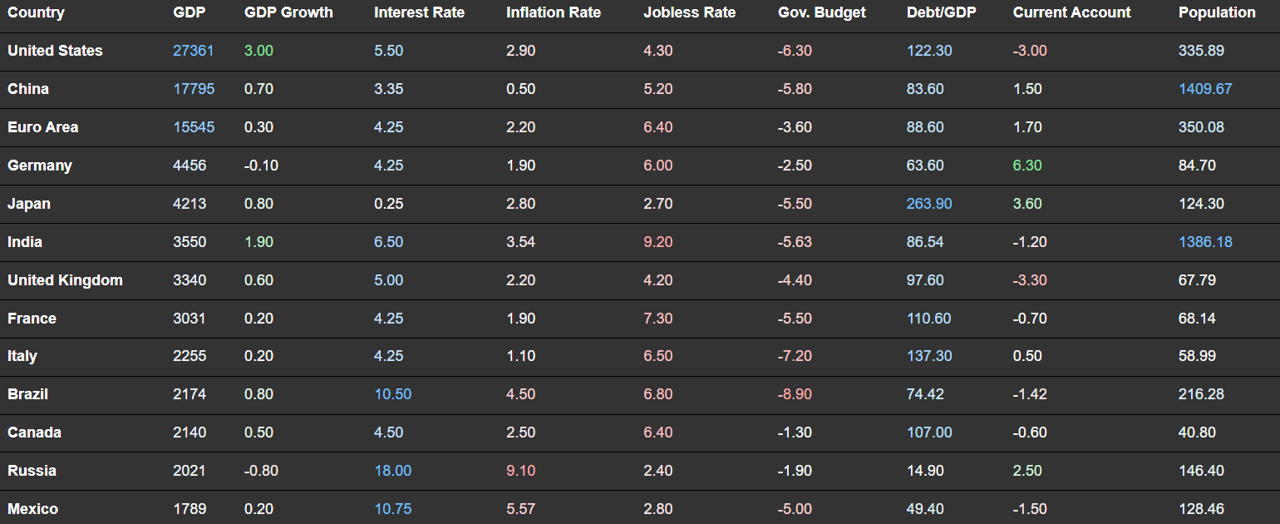
Macroeconomic Data

Whenever you're ready there is one way I can help you.
Emre Aksahin
Chief Learning Officer at Edgenie


